Bitcoin breaks above 21 EMA resistance in 5 waves
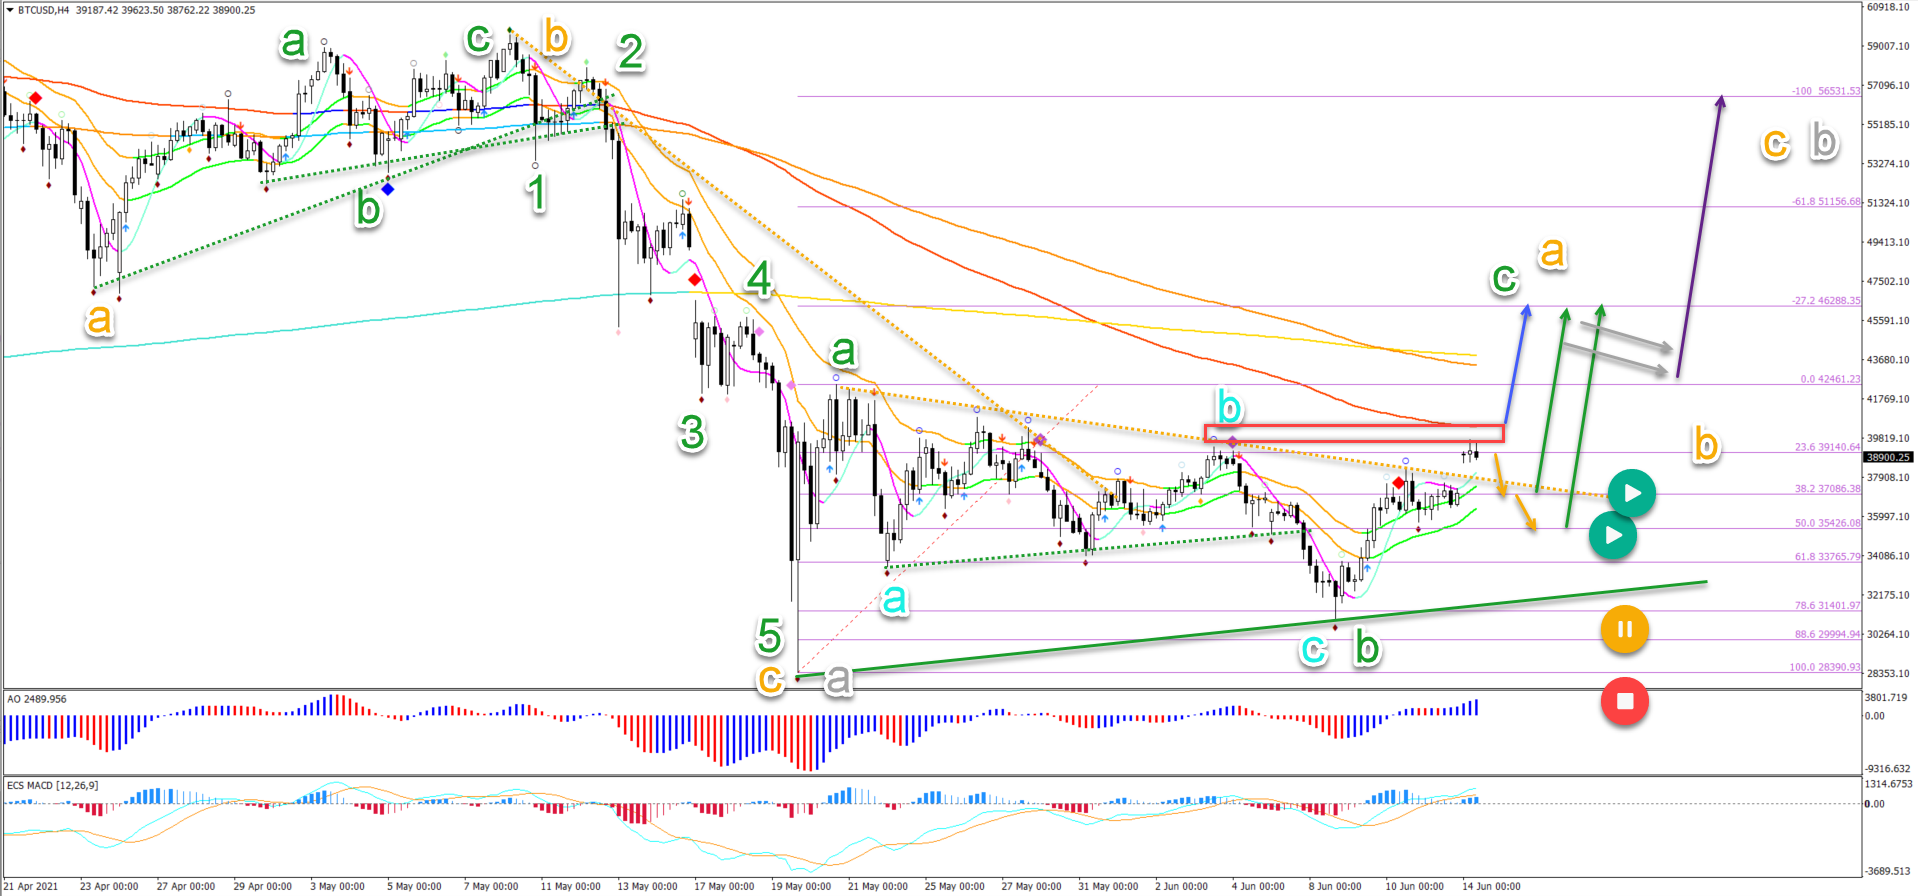
- Bitcoin (BTC/USD) made a bullish bounce at the 78.6% Fibonacci retracement level. It was followed by a bullish breakout above the 21 ema resistance zone.
- But price action still faces hefty resistance (red box) from the previous top and long-term moving averages.
- Price action managed to break above the resistance trend line (dotted orange) during the weekend.
This article analyses the expected Elliott Wave and FIbonacci patterns on the Bitcoin 4 hour and 1 hour charts.
Bitcoin (BTC/USD) H4 Chart
Price charts and technical analysis
The BTC/USD made a strong bullish reversal after testing the previous bottom and Fibonacci retracement levels:
- The bullish reversal is probably part of a ABC (green) wave or even a potential 123.
- Price action managed to break above the resistance trend line (dotted orange) during the weekend.
- But price action still faces hefty resistance (red box) from the previous top and long-term moving averages.
- A bearish bounce (orange arrows) could retest the support again where a bullish bounce is expected (green arrows).
- A bullish breakout (blue arrow) could indicate an immediate push up. A bull flag pattern (grey arrows) could indicate even more upside (purple arrow).
- A break below the support line (green) places it on hold (orange circle) and a break below the bottom invalidates it (red circle).
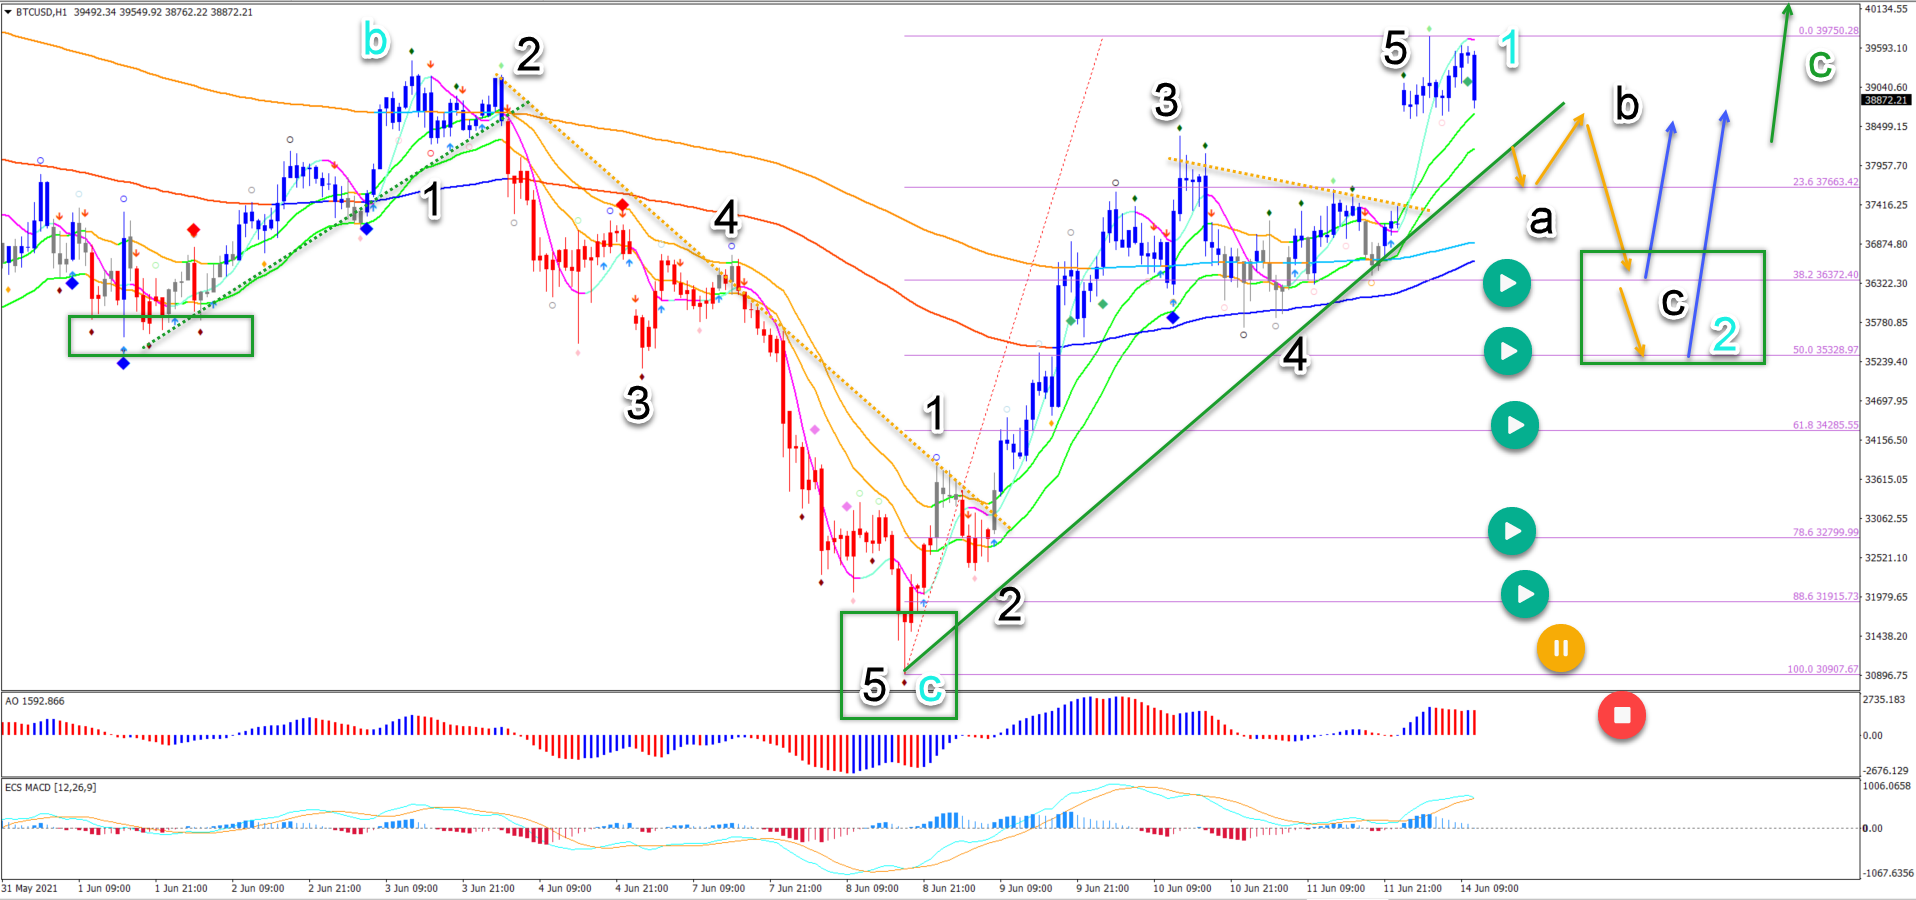
On the 1 hour chart, price action is showing strong bullish momentum:
- A 5 wave pattern (black 1-5) seems to be visible.
- The bullish 5 waves could complete a wave 1 (blue).
- A bearish ABC (black) could indicate a wave 2 (blue).
- The Fibonacci retracement levels of wave 2 could act as support (blue arrows).
- Especially the support zone (green box) could indicate a bounce due to the inverted head and shoulders pattern.
- All Fibonacci levels are potentially support levels.
- A break below the 88.6% Fib makes it less likely (orange circle) whereas a break below the bottom invalidates it (red circle).
Bitcoin (BTC/USD) H1 Chart
The analysis has been done with the ecs.SWAT method and ebook.
By Chris Svorcik
Chris Svorcik has co-founded Elite CurrenSea in 2014 together with Nenad Kerkez, aka Tarantula FX. Chris is a technical analyst, wave analyst, trader, writer, educator, webinar speaker, and seminar speaker of the financial markets. He is also the creator of the trading method called ecs.SWAT (Simple wave analysis and trading) which is based on chart and price patterns. On this topic, he has completed a SWAT eBook and co-created automated trading systems.
The opinions expressed here are solely those of the author and do not necessarily reflect the views of Forex Quebec. Every investment and trading move comes with risk, you should do your own research when making a decision.
Keep your cryptocurrencies safe!
The Ledger Wallet is the most advanced storage device for securely holding and using Bitcoin and other cryptocurrencies.


